Navigate the GatherMed Platform
The GatherMed platform has three main sections that can be accessed when you log in.
- Readings
- Patients
- Devices
Each of these sections plays a different, but significant role, in providing the best care for your patients. After completing this learning guide, you’ll be able to:
- Understand patient readings
- Find patients in the platform
- Search for devices
- Filter by date or patient information
Readings Dashboard
The Readings Dashboard is the homepage of the GatherMed Platform and will always be the first page you see when you login. By default, the Readings Dashboard will show the latest patient readings sent to the platform. Using the Report Dates section, you can change the current date settings to:
- Today
- Week
- Month
- Year
- Custom Date Range
- Use the Start Date and End Date calendars to set a custom date range

The Readings Dashboard displays relevant information about patient blood pressure and weight. You can use the Blood Pressure tab and the Weight tab to switch between readings.
The Blood Pressure tab displays the following information:
- Patient Name
- Date/Time - when the reading was taken
- Identifier - Unique ID of patient device
- Battery % - the battery life of the patient’s device
- Signal % - cell signal of the device when the reading was received
- Measurement
- Green/Red Outline
- Green - In range
- Red - Out of range
You can also directly interact with a reading using the following:
- Eye Icon - access a patient’s profile
- Clock Icon - start an encounter with patient
- Red X - delete a reading
- This is not recommended and reserved for certain situations, such as someone else using the patient’s device, etc.
Patients Dashboard
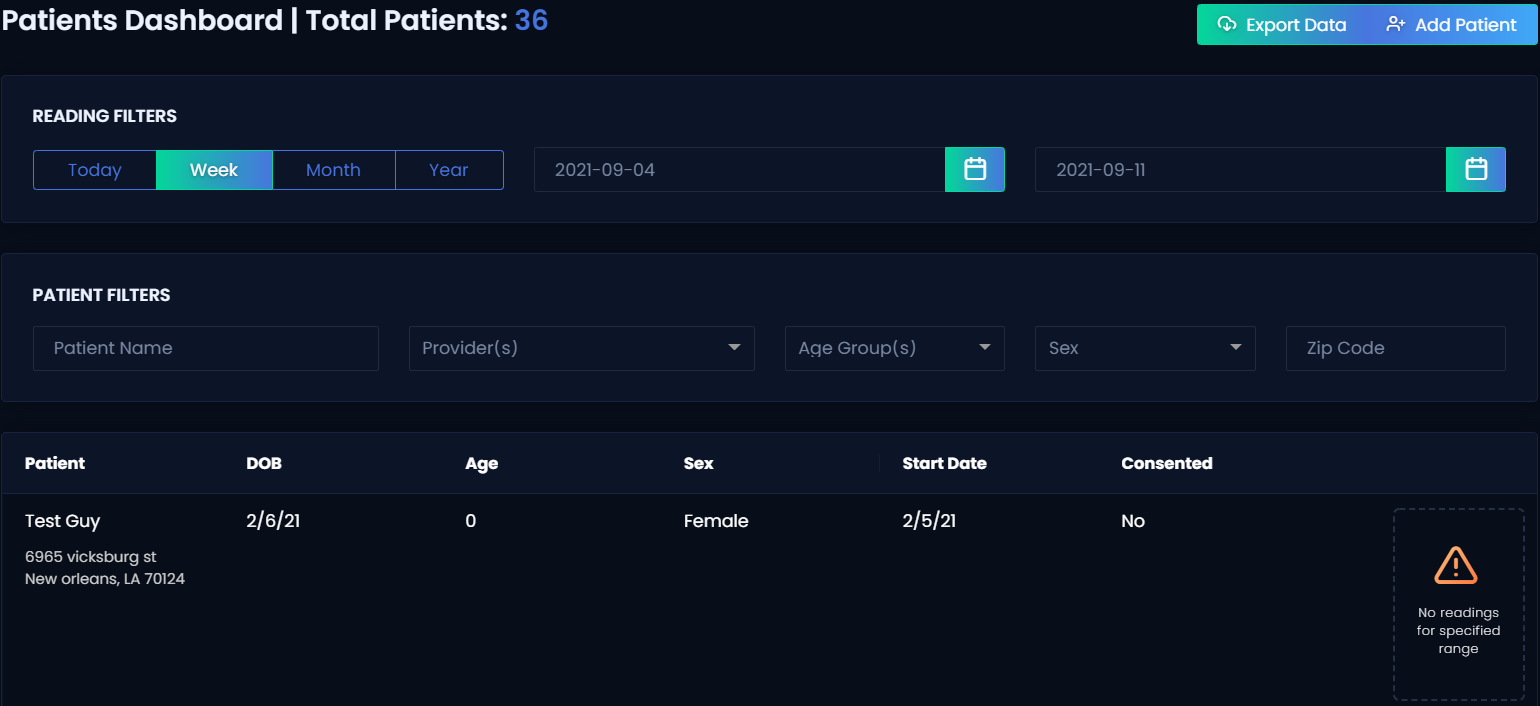
Patients Dashboard is used to find individual patients and access their profiles. The dashboard also allows you to see the total patients in a group, add new patients and export reports. The dashboard includes filter options to help navigate to individual patient profiles.
These filters include:
- Date
- Name Search
- Patient Information
- Provider
- Age Group
- Sex
- Patient Zip Code
The Patients Dashboard also displays relevant patient information, such as:
- Patient Name
- Address
- Date of Birth
- Age
- Sex
- Start Date
- Patient Consent
The Patients Dashboard will also display the patient’s readings over a selected date range on a graph. This Readings Graph will plot the readings from left (good) to right (bad).
 To access a Patient Profile click anywhere on the patient. This is one of many ways to access a Patient Profile. We will learn how to set up a patient profile in a later section.
Devices Dashboard
The Device Management Dashboard allows you to keep track of all your devices. It is an inventory of your devices and where they are assigned. In this dashboard, you can find devices assigned to individual patients, track device delivery, find a device id or see which devices are currently unassigned to a patient.
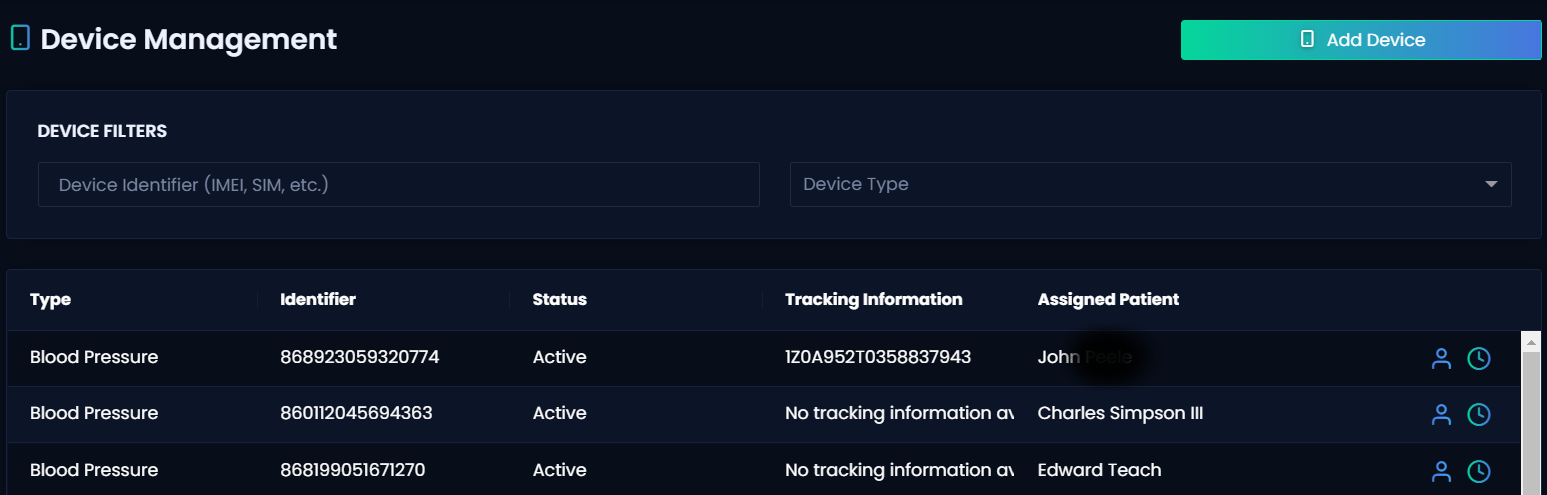
The dashboard allows you to search by Device Identifier or Device Type. It also displays relevant device information, such as:
- Type - blood pressure, scale, etc.
- Identifier - the unique id assigned to individual devices
- Status - Active, Pending, Deactivated
- Tracking Information
- Assigned Patient
You can also use the Person Icon to access a Patient Profile and the Clock Icon to log an encounter. In a later section, we will cover how to add new devices using the Add Device button at the top right.